Contents
The Command Dashboard is your landing page in gPanel as an Enterprise client. Its tiles show the health of your environment, what needs your attention, and what gPanel has done on your behalf.
The Command Dashboard is exclusive to the gPanel Enterprise tier. Please contact our sales team or your dedicated Client Success Manager to discuss upgrading your account
What You’ll See
Accounts created before the dashboard launch start with three tiles: Activity Logs, Rules Engine and Active Users. You can add more at any time. What you see in each tile depends on your admin role. If your role doesn’t have access to a tile’s data, the tile shows an insufficient access message.
Add a tile
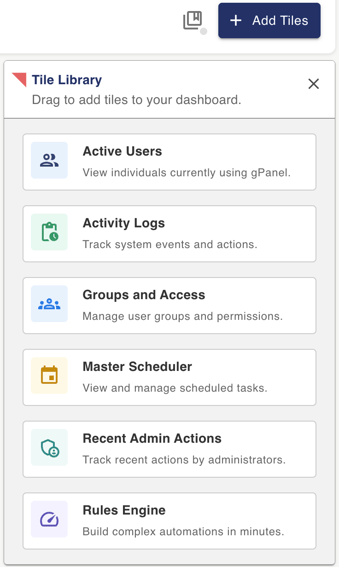
- Click Add Tiles in the upper right of the dashboard
- Select a tile from the list. Only tiles not already on your dashboard appear
- The tile is added at the bottom of the dashboard
Arrange your tiles
Tiles can be resized and rearranged, with up to three tiles in a row.
Save a view
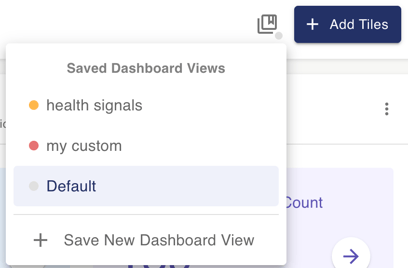
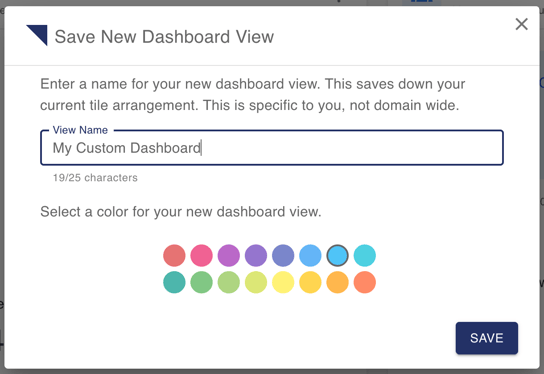
- Click Save Dashboard View, to the left of Add Tiles
- Click Save New Dashboard View at the bottom of the list
- Enter a name, choose a color and click Save.
The last view you loaded opens by default next time.
Dashboard Tiles Overview
The Command Dashboard provides various tiles to give you insights into your gPanel environment. Note that tile visibility and data access are based on your assigned admin role. If you don't have permission for a tile's data, you will see a message indicating insufficient access.
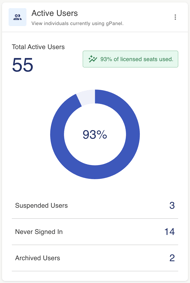
- Active Users: Provides an overview of the user base and seat utilization. Displays total active users, a progress bar of licensed seats used, suspended users, archived users, and users who have never signed in.
- Sizes (width): Whole, half, one-third
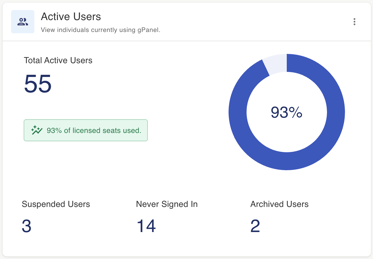
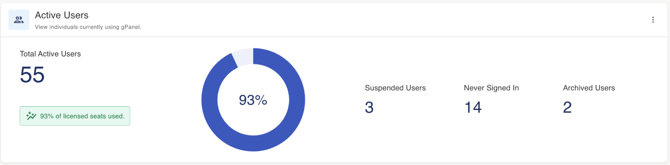
- Sizes (width): Whole, half, one-third
- Activity Logs: Highlights potential security risks with a 7-day sparkline chart of Workspace logins. Flags failed logins today and suspicious logins from unrecognized locations in a warning color to prompt immediate review.
- Sizes (width): whole, half, one-third
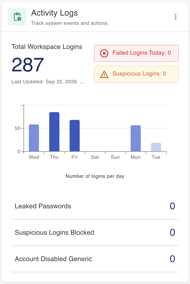
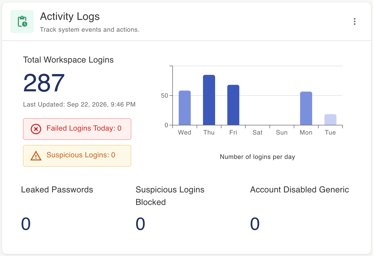
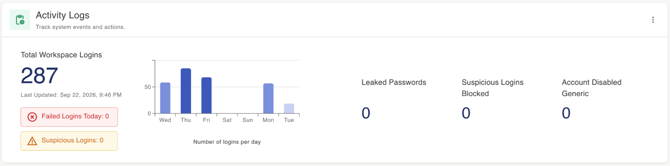
- Sizes (width): whole, half, one-third
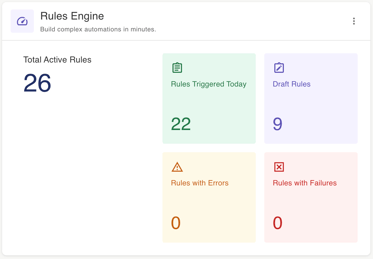
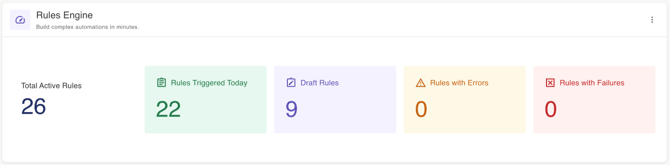
- Rules Engine: Summarizes automation health by displaying the total count of active rules, rules triggered today, draft rules, and explicitly highlighting rules with errors or failures that require admin attention.
- Sizes (width): whole, half, one-third
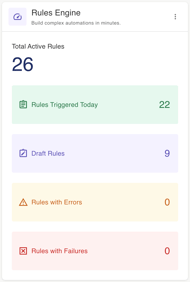
- Sizes (width): whole, half, one-third
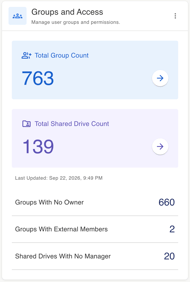
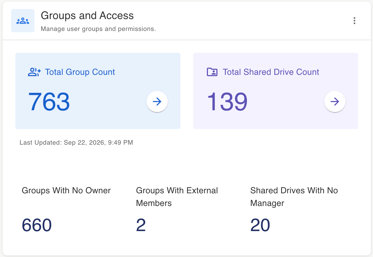
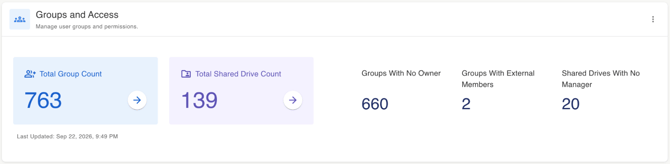
- Groups and Access: Displays total group count and total shared drive count. Also shows Groups with no owner, Groups with external members, shared drives with no manager.
- Sizes (width): whole, two-thirds
- Sizes (width): whole, two-thirds
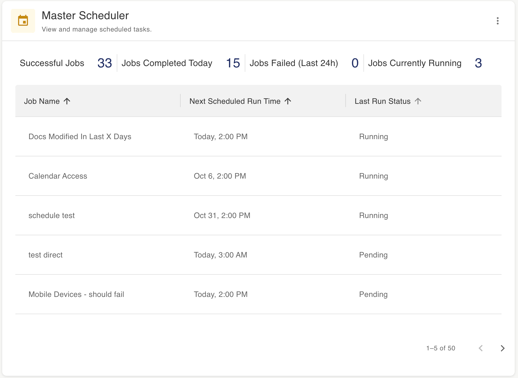
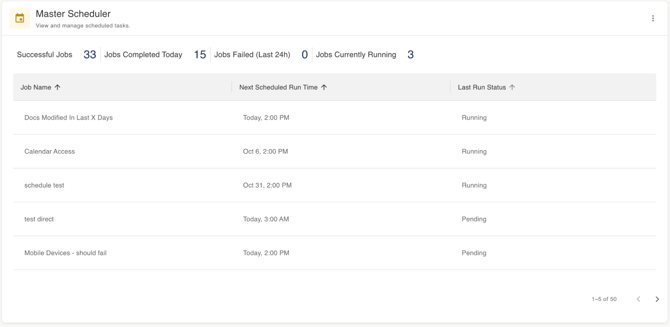
- Master Scheduler: Displays list of upcoming or recently completed scheduled events/jobs, ordered chronologically by next run time. Shows each job name, the next scheduled run time and the last run status.
- Sizes (width): whole, two-thirds
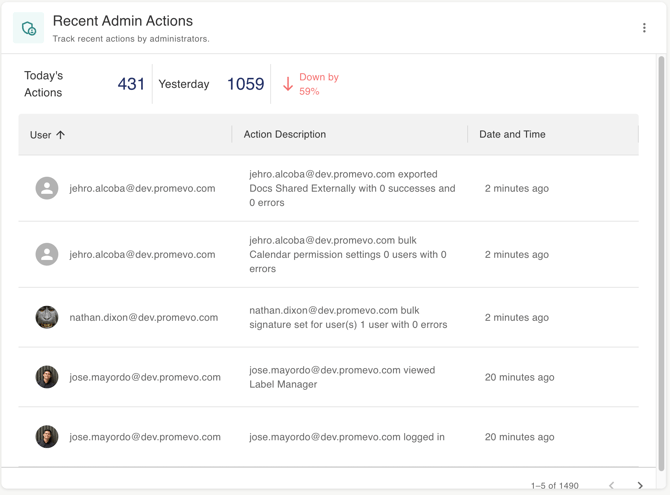
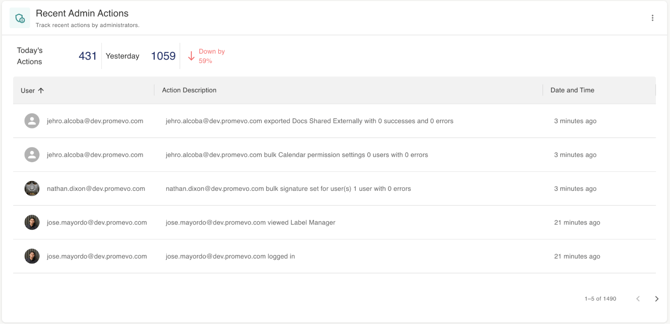
- Recent Admin Actions: Displays list of actions taken within gPanel, showing who did what and when. Each entry displays the acting admin’s name and/or avatar, a short description of the action taken and a relative timestamp.
- Sizes (width): whole, two-thirds