
Contents
Navigating the cPanel Logs Interface
One of the primary advantages of using gPanel is the ability to centralize your administrative tasks. The cPanel Logs tool provides a direct window into your Google Workspace native audit logs, capturing every event that occurs within the Google Admin console.
Instead of navigating away from your gPanel dashboard, you can monitor domain-wide changes, security events, and user activity in one place. This ensures that your "Source of Truth" for domain security is always at your fingertips.
Navigating the cPanel Logs Interface
When you navigate to Reports > cPanel Logs, you are presented with a high-fidelity table of events. To help you manage thousands of entries, gPanel provides several sorting columns:
-
Date: The exact timestamp of the event.
-
Event Name: The specific type of action taken (e.g., Password Change or Settings Update).
-
Description: A detailed breakdown of the change made.
-
Actor: The email address of the user who performed the action.
-
IP Address: The network location from which the action was initiated—a vital data point for security audits.
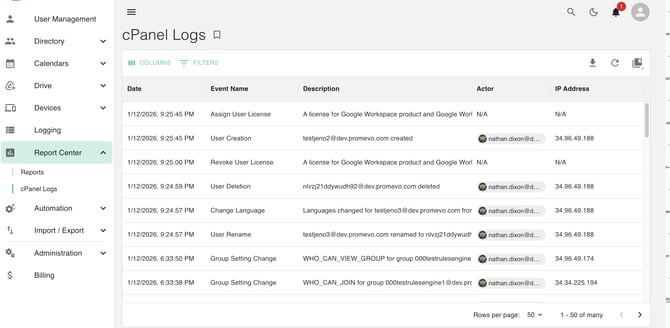
To organize this data, simply click on any column heading to sort the information in ascending or descending order.
Advanced Filtering for Security Reviews
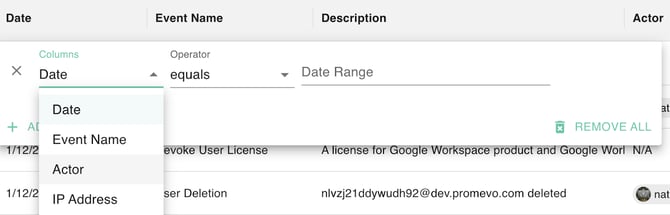
For deeper investigations, the Select Filter icon allows you to isolate specific data points. Depending on your selection, the interface will adapt to provide the most relevant tools:
-
Text Boxes: Used for specifying specific actors, event names, or IP addresses.
-
Date Ranges: Use the calendar dropdown to define a precise investigation window.
-
Dropdown Menus: Select from pre-defined categories to refine your search quickly.
After configuring your parameters, click the Add Filter icon (see below). You can "stack" multiple filters to create highly specific search queries. Once the filters are applied, the table updates automatically to show only the relevant records.

Exporting Logs for Compliance
For organizations that require long-term retention or external reporting (such as for HIPAA or SOC2 audits), gPanel allows you to move these logs into a portable format.
By clicking the Export icon in the top right corner, the system generates a Google Sheet in your Drive, allowing you to perform advanced data analysis or share reports with legal and security stakeholders.