


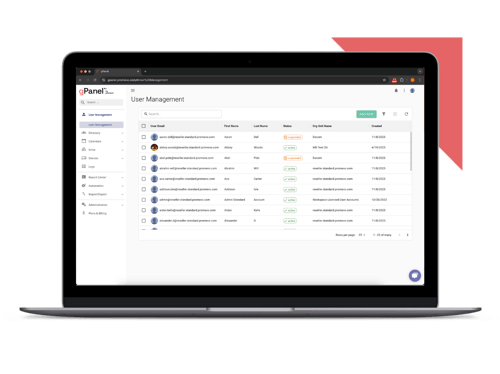
 User Management
 Group Management
 OU Management
 Gmail Management
 Drive Management
 Calendar Management
 Device Management
 Workspace Reporting
 Workspace Automation
 Billing & License Management


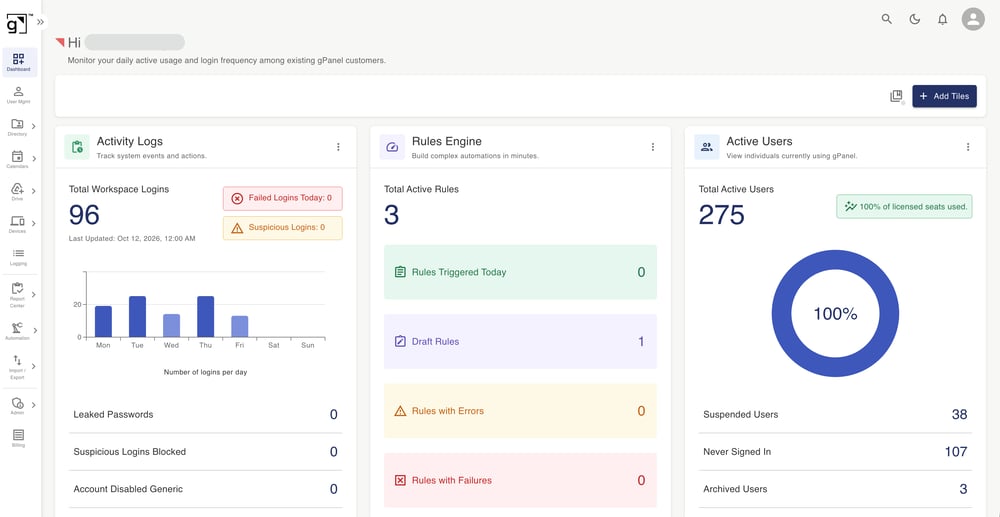
We're excited to introduce you to the Command Dashboard, a new landing page experience for gPanel Enterprise customers designed to give administrators immediate, actionable visibility into their Google Workspace environment.
What's Changing
The Command Dashboard serves as the default central hub upon logging into gPanel. Instead of a blank canvas or standard page, admins can now monitor environment health, potential security risks, and automated background tasks at a glance.
Key features include:
- Customizable Dashboard Layouts: Admins can add, resize, and reorder interactive tiles in up to three columns, and save personalized dashboard views (e.g., Health Signals, Security Overview).
- Role-Based Access Control: Tile data directly reflects an administrator's assigned gPanel permissions. If a user lacks access to a specific tile’s dataset, an informative "insufficient access" message is displayed.
- Click-Through Navigation: Interactive tile elements allow admins to seamlessly drill down into corresponding gPanel functional areas for deeper management.
Available Dashboard Tiles
- Active Users: Track seat utilization (licensed vs. used), suspended users, archived users, and accounts that have never signed in.
- Activity Logs: Monitor a 7-day sparkline trend of Workspace logins and receive warning visual indicators for today's failed logins or suspicious unrecognized login locations.
- Rules Engine: View automation health metrics, including active rules, rules triggered today, draft rules, and alerts for rules with errors or failures.
- Groups & Access: Review high-level group and shared drive counts while surfacing risk factors like unowned groups, external member access, and unassigned shared drive managers.
- Master Scheduler: Track upcoming and recently completed background jobs, ordered chronologically with run times and execution statuses.
- Recent Admin Actions: Audit recent administrator activity in gPanel (who did what and when) with relative timestamps.
You can review the help documentation for this new feature in the gPanel Knowledge base.
Who’s Impacted
Administrators
Why It’s Important
Previously, logging into gPanel meant navigating directly to a task without a high-level view of your domain, making critical background activity and environment health invisible between routine tasks.
The Command Dashboard changes that by surfacing key operational metrics the moment you sign in:
- Immediate Security Awareness: Instantly spot failed login attempts or unrecognized location flags before they turn into incidents.
- Proactive Oversight: Surface unowned groups, unmanaged shared drives, or failing automation rules without having to run manual reports.
- Optimization & Value Tracking: Keep tabs on seat utilization, active rules, and background scheduler jobs to ensure your organization is maximizing its gPanel setup efficiently.
Rollout Pace
These changes have already been fully deployed and are live in the gPanel platform.
Availability
The Command Dashboard is available in the gPanel Enterprise tier.